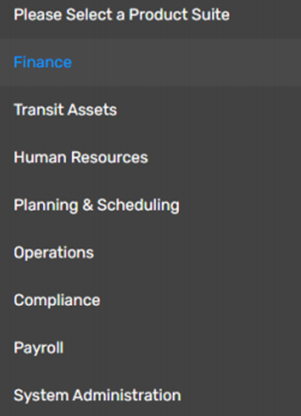
Avail customers who have both the FleetNet ERP application and Business Intelligence v1.7 or later can access the ETMS dashboards and reports. These dashboards pull data from Avail’s FleetNet ERP and CAD/AVL products and are located throughout the Enterprise Transit Management Suite (ETMS). This guide identifies the Product Suite where you can find each dashboard. The dashboards that you can view depend on your position in the agency.

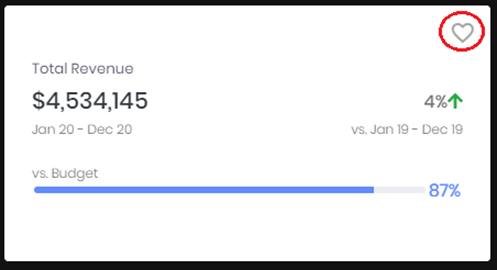
Additionally, click the heart on any dashboard you want to appear on the ETMS homepage.

Standard Dashboard Icons
Many dashboards have a filter ![]() icon at the top-left. Clicking this icon allows you to apply filters to all panels in the dashboard. For example, you might filter all financial metrics by a particular fiscal year.
icon at the top-left. Clicking this icon allows you to apply filters to all panels in the dashboard. For example, you might filter all financial metrics by a particular fiscal year.
At the top-right, the dashboards have the following icons:
-
 Bookmark the report
 -
 Create a PDF of the dashboard
All panels have gear and information icons:  These icons relate to an individual panel.
- Click the gear icon to change the panel’s For example, you can change a metric’s target value or a chart’s sort order.
- Clicking the information icon to display information about the metric and how the system calculates it.
Typical Panel Layout
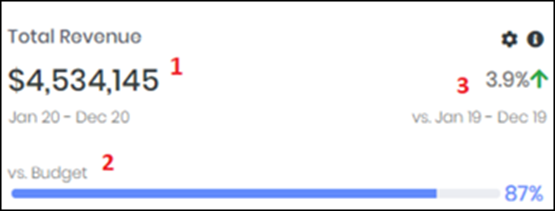
Many panels in the dashboards have similar layouts. Understanding the standard formats helps you to interpret all panels. The red numbers below illustrate standard panel information.

- Total value for the metric.
- How the metric compares to the budget or other target.
- How the metric compares to a previous time period.