Avail’s Business Intelligence (BI) is an interactive system that allows you to change the data visualization on the fly. After determining which report you need to work with, you might need to customize it to answer your specific business question.
There are two methods for interactively changing how BI displays your data, drilling down and filtering. These two methods function differently. It’s important to know how they differ so you can obtain the results you want.
NOTE: Bookmarks remember all filters you apply to a report. However, bookmarks do not remember all drill-down conditions. Consequently, if you want a bookmark to recreate a custom report, use only filters during customization process.
Drilling Down by Clicking the Graph
In the context of Avail’s Business Intelligence, “drilling down” refers to the process of clicking on a graph to view the data differently.
The drill-down feature functions differently than filtering, which the next section discusses. When you choose a drill-down option, BI does the following:
- Retains the original outcome variable on the vertical axis.
- Changes the horizontal axis variable to the drill-down variable.
- Filters the data by the value that you clicked in the chart initially.
On a bar chart or line chart, you can click a bar or data point to focus on it. For example, on a bar chart that displays Ridership counts by Route, click a bar to focus on a route.
When you click a bar, a popup menu displays the options for further drilling down in your data, as shown below. For example, in the Farebox & APC Analysis report that displays ridership by route, if you click a bar that corresponds to one of the routes, BI displays the following popup menu.

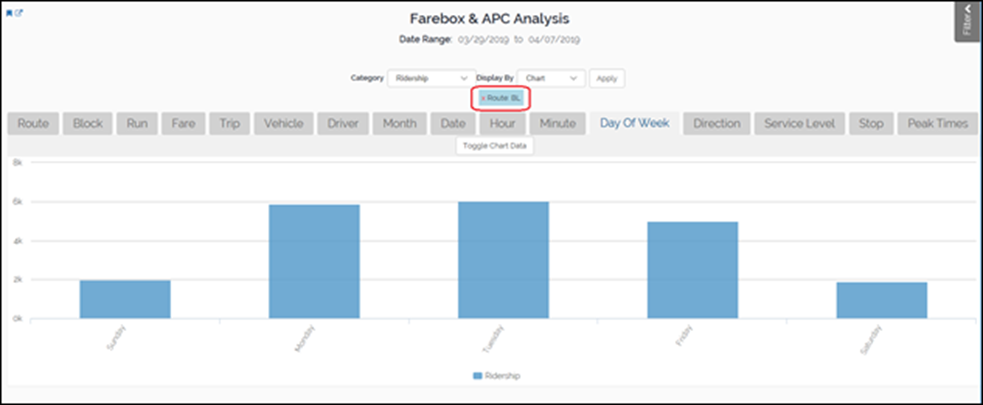
If you click the bar for route BL and choose Drill to Day of Week in the menu, the new visualization continues to display Ridership counts for the outcome variable but changes the grouping variable to Day of Week. Additionally, the new chart only displays ridership counts that occur on route BL, as shown below.

In the screenshot, notice the circled item that indicates that BI is showing data for only Route BL. Click the red X in the filter indicator to clear the filter.
Filtering Your Data with the Filter Panel
You can also use the Filter slide out panel to filter your data. Click the Filter tab on the top-right to expand the filter panel, which is partially shown below.

Note that the drill-down and filtering functionalities work differently. The drill-down functionality changes the variable on the horizontal axis to your drill-down choice. However, filtering retains the original variables on both the vertical and horizontal axes, but it only includes outcome data that matches your filter specifications.
In the filter panel, the first thing you need to specify is the date range to display on the chart. Choose a range using one of the following two methods:
- Specific Date: Use the calendar tool to pick the precise starting and ending dates.
- Sliding Date: Choose a date range by selecting the end of the range and specifying the number of days to count back from that end date.
After the date field, there is a series of variable fields. Use these fields to filter by values of these variables. The fields filter data using the following methods:
- A blank field indicates that the corresponding filter is not active.
- Fields with values in them indicate that BI is filtering the data to include only data that matches the values that are listed in the fields.
- BI uses the Boolean OR for values within the same field. For example, if Day of Week displays Tuesday and Thursday, BI displays data that occurs on Tuesday OR Thursday.
- When multiple fields contain filter values, BI uses the Boolean AND between those For example, if Day of Week displays “Tuesday” and Month displays “November,” then the graph only displays data that occur on Tuesdays in November (i.e., Tuesday AND November).
To begin filtering your data, you can use two methods:
- Click in a blank field to display a list of possible values and choose values that you want to include on the chart one at a time.
- Click Select All to include all possible values in the field, which is equivalent to not filtering the data. Then, deselect values that you want to exclude from the chart by clicking the Xs next to those values.
You can use either method to achieve the same results. If you want to include data for relatively few values in a field, it is easier to start with a blank field and add those values individually. However, if you want to include most values and exclude only a few values, it is easier to click Select All and remove the values you do not want to include.
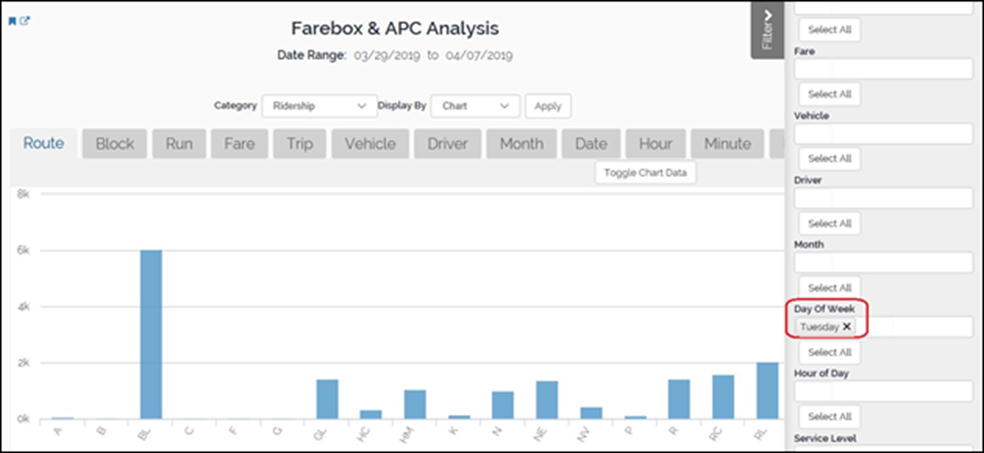
For example, if you display Ridership by Routes, filter by Day of Week, and choose Tuesday, BI displays the following:

This chart displays the total ridership by route, but ridership only includes the counts that occur on Tuesdays, as the circled Day of Week filter indicates.
If you add filters values to other fields, BI places the Boolean AND between them. For example, if you add a filter for the month of November to the example above, the ridership counts for each route reflect only those that fall on Tuesdays in November (Tuesday AND November). If you then add Route BL, the chart displays data only for Route BL, on Tuesdays, and in November (Route BL AND Tuesday AND November).
To determine whether BI is filtering the data that the chart displays, check the filter panel for active filters.