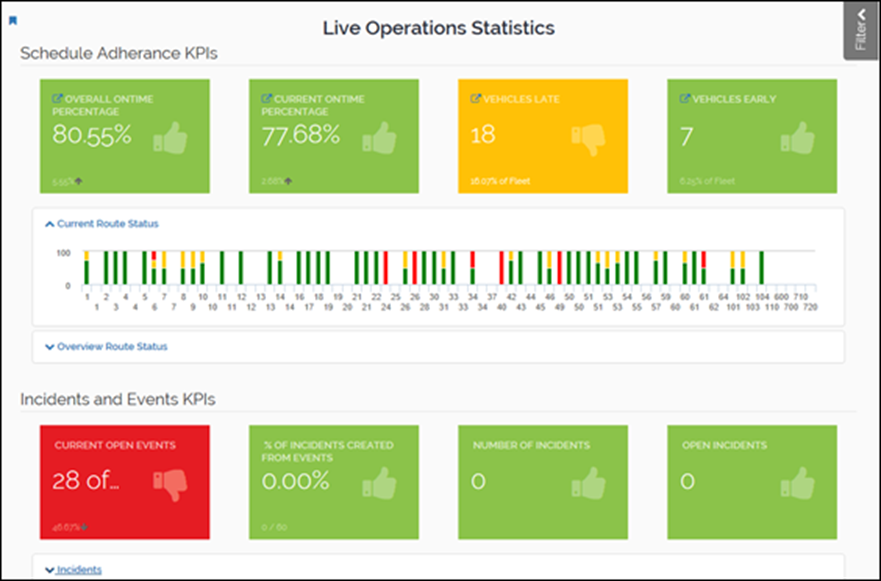
Use the Live Operation Statistics overview to assess transit system performance using a green, yellow, and red color coding. At a glance, you will know whether the transit system is running properly and be able to identify the nature and location of problems.
From this report, learn the overall on time percentage, current on time percentage, how many vehicles are late, and how many are early. It also displays how individual routes are performing. In some situations, the overall transit system can be performing satisfactorily but a particular route will have problems.
Avail’s Business Intelligence defines current and overall as follows:
- Current: What is happening right now. The system refreshes these values very frequently
- Overall: The accumulation over the course of the day up until the present moment.
This report also tracks incidents and events. Use this section of the report to determine whether the number of open events, the number of incidents created from events, and the number of incidents are acceptable. When there are too many events or incidents, transit personnel should determine whether adjustments are necessary.

The QA View will only contain incident KPIs for detours and decision support as well as incidents from the Avail Incident Management (Compliance Module).