Use this dashboard to understand your agency’s current schedule performance and gain insight into long term trends. The Planning Dashboard uses data from Avail’s CAD/AVL system. If your property does not have this system, the dashboard cannot display planning information.
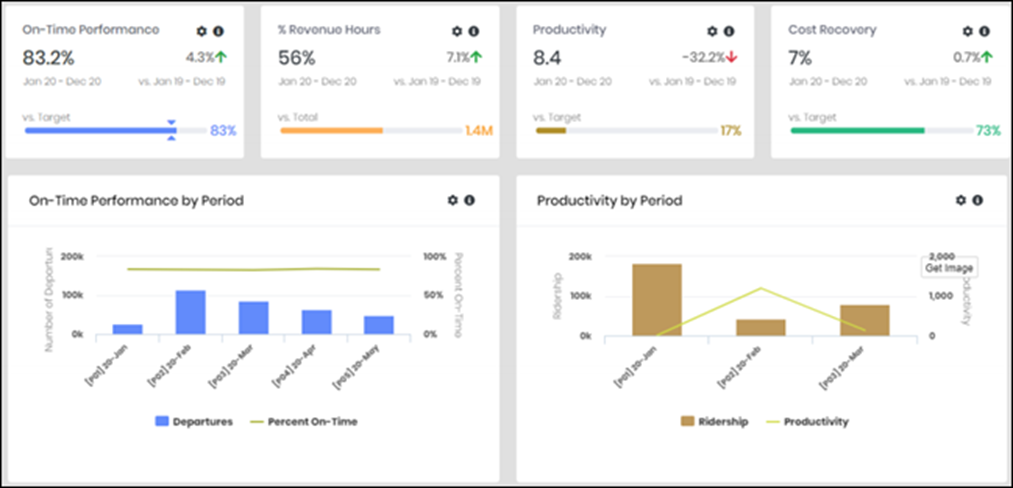
Review current metrics and trends in on-time performance, schedule productivity, revenue hours, and cost recovery. This information allows you to target schedule improvements for specific concerns that are negatively impacting your agency’s financial position.
This dashboard allows you to do the following:
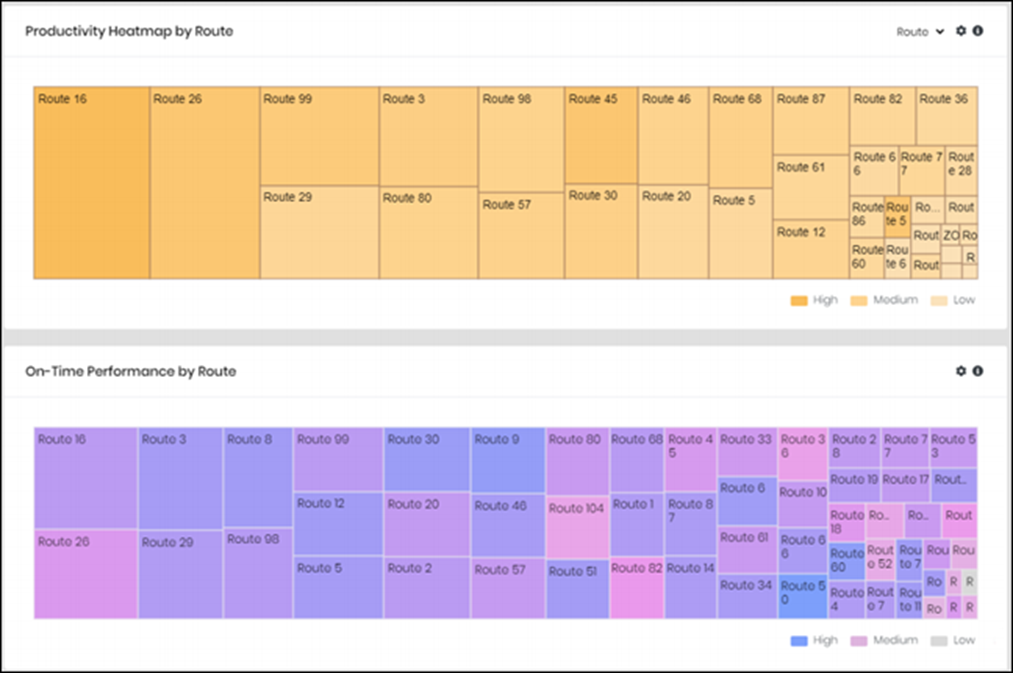
- Assess overall on-time performance and identify routes with problems.
- Track current schedule productivity by the ratio of ridership to revenue hours and identify underperforming routes.
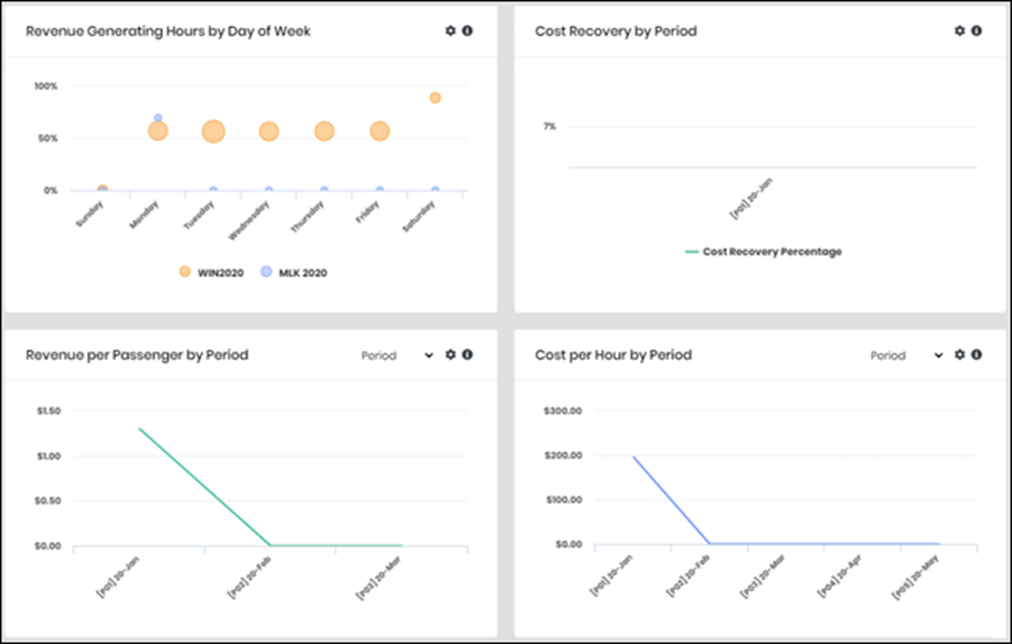
- Evaluate the current percentage of labor hours that generate revenue.
- Monitor revenue per passenger and cost per hour.
- View the percentage fare costs that have been recovered by fare revenue for the cumulative fiscal year.
The dashboard compares the metrics to target values, over time, and by various groupings, including the following:
- Routes: Displays on-time performance and productivity by routes.
- Period: Displays metrics by similar timeframes, such as day of the week, months, and fiscal years.
Click the global filter icon at the top  to restrict data to specific Fiscal Years for all panels in the dashboard.
Click the information icon by a panel  to learn about its metrics and how the system calculates them.


