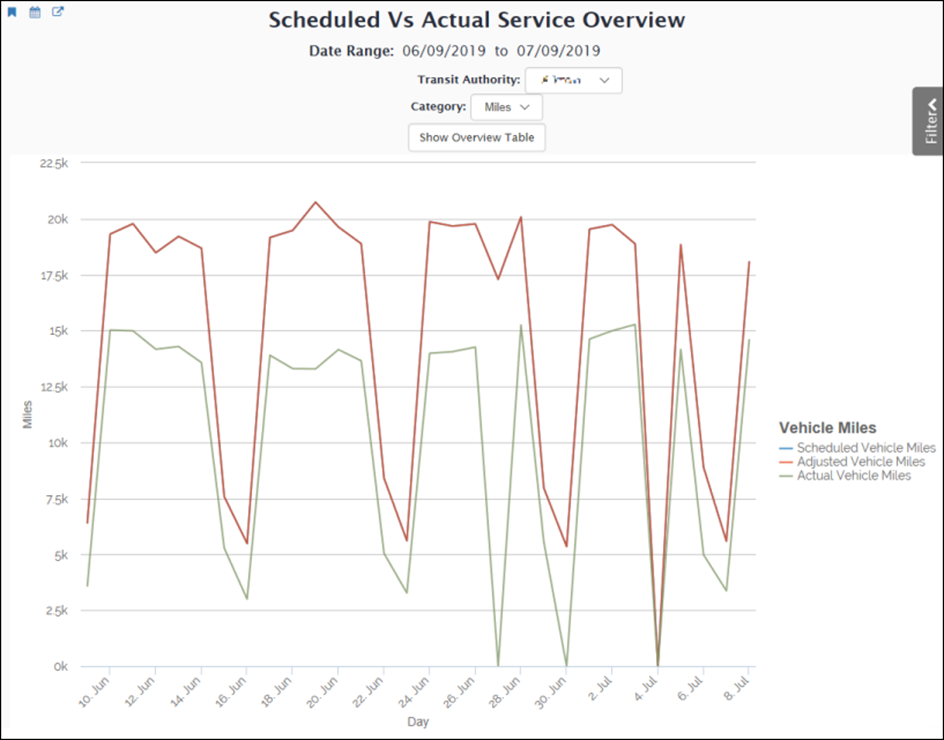
The Scheduled vs. Actual Service Overview displays scheduled, adjusted, and actual vehicle miles or vehicle hours for the date range that the filter pane specifies.
This report calculates miles and hours using the following two methods:
- Adjusted miles take the scheduled miles and hours, and then adds and subtracts recorded exceptions.
- Actual miles are based on system and GPS data.
Adjusted miles are more accurate when your property does not have a very high data collection rate (i.e., many missing stop reports).
Vehicle miles and hours are the sum of non-revenue and revenue values.
This Overview chart has two related tabular reports that provide more detailed information. These two tables are the Scheduled vs Actual Service Breakdown and the Vehicle Miles (Or Hours) Overview Table.

The default chart displays miles on the vertical axis. However, use the Category drop-down list at the top of the report to display one of the following:
- Miles
- Hours
Compare the differences between the three different values: scheduled, adjusted, and actual vehicle miles or vehicle hours. If there is a large difference between the adjusted and actual values, it might be due to a low data capture rate, which can cause many missed stop reports. To assess the data capture rate, click the Show Overview Table button above the Scheduled vs. Actual Service chart.
Clicking a data point for a specific date in the Scheduled vs. Actual Service Overview chart displays the Scheduled vs. Actual Service Breakdown table for that date, which the next section explains.
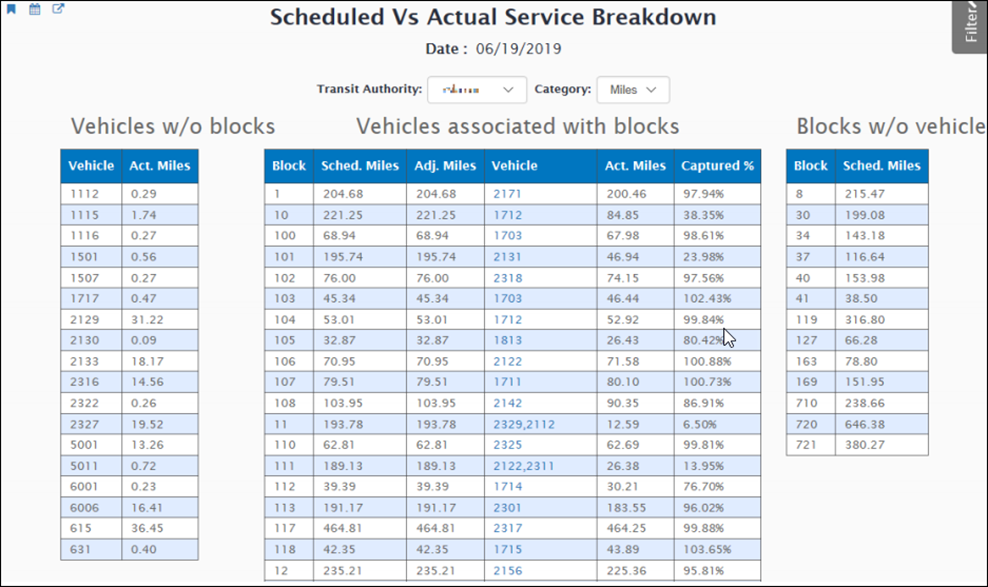
Scheduled Vs. Actual Service Breakdown
The tables in this report display more detailed information about the scheduled and actual service metrics for a single day. These three tables display the scheduled, adjusted, and actual miles or hours by vehicles. These tables further breakdown the vehicles into the following three groups:
- Vehicles without blocks table displays vehicles that accumulated miles or hours while not associated with a scheduled block.
- Vehicles with blocks table displays vehicles that accumulated miles or hours along with the data capture rate for vehicles assigned to a block. The data capture rate allows you to assess the accuracy of the actual miles, which the system calculates using GPS data.
- Blocks without vehicles represents scheduled service that was not associated with a vehicle.
In the Vehicles associated with blocks table, click a vehicle number to display the Miles and Hours report for that vehicle.

Vehicle Miles and Vehicle Hours Overview Table
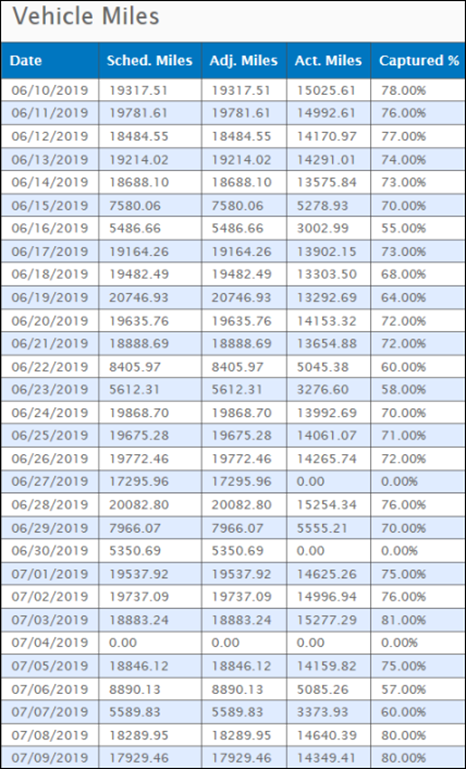
To display a tabular version of the data in the Scheduled vs. Actual Service chart, click the Show Overview Table button above that chart. This report is particularly useful for assessing data capture rates, which affects the accuracy of the Actual Miles and Actual Hours values.
This table displays scheduled miles or hours, adjusted miles, actual miles, and Capture%. Low data capture percentages can explain large differences between adjusted miles and actual miles because the system uses GPS data to calculate these values. Consequently, if your property does not have high data capture rates, you should use the adjusted miles and adjusted hours.
- Adjusted miles/hours: Scheduled miles +/- daily exceptions entered in myAvail.
- Actual miles/hours: System calculates these values using GPS data.
- Captured%: Percentage of scheduled miles that the system captured (Act. Miles/ Miles).
Click a heading to sort the table by that heading.
