The Fixed Route Performance Dashboard displays critical metrics in both a dashboard format and as year-to-date tabular reports for printing. This report blends standard reporting while providing guided myDash functionality. Users can store metrics manually in the data warehouse and leverage them later for reporting. This report has four screens: Dashboard, Target Definition, Monthly Metrics, and Fixed Route Performance.
Dashboard
Using the dashboard, select any metric that the system or a user generates. Then display the performance of that metric against a performance goal you specify for either the previous month or year-to-date (YTD). Use the gear icon to select the metric they want to track and set the date range.
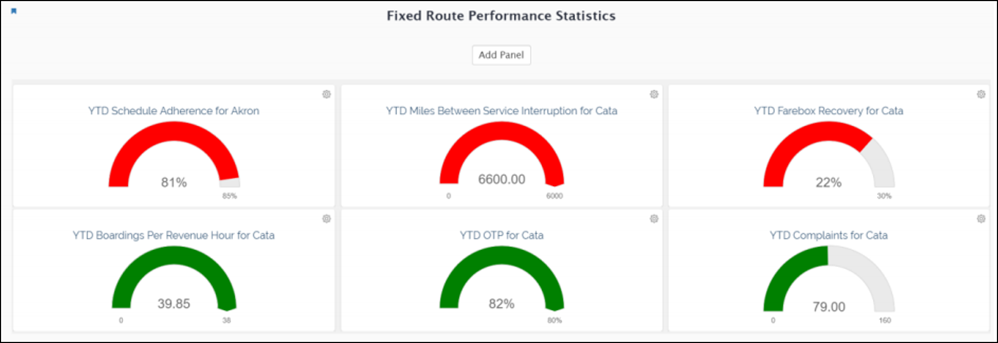
Click the three buttons below the dashboard to access the additional screens described below.
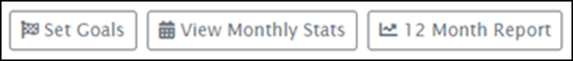
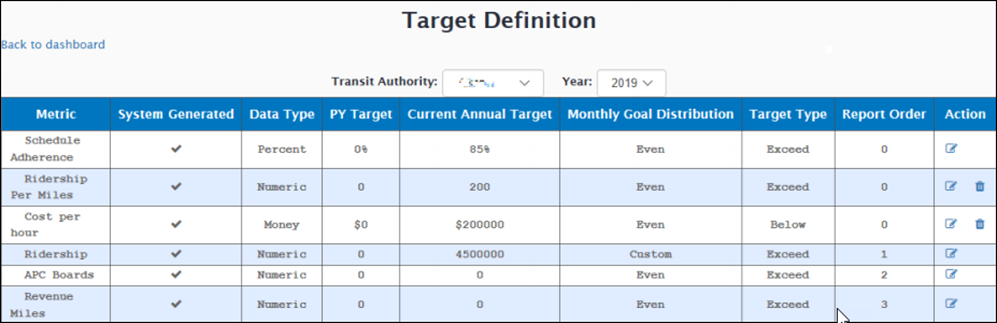
Set Goals - Target Definition
To define the targets, click the Set Goals button below the dashboard. Use this screen to add metrics, set targets, define how the target is distributed across the year, define the target as a minimum value that you want to exceed or a maximum value that you want to stay below, and define the display order for the metrics on the 12-month report. The 12 -month report does not display metrics that have a report order of 0.
To add a new metric, click the Add Metric button, which is below the Target Definition table. To edit an existing metric, click  for that metric in the Action column. Click
  to delete a metric.
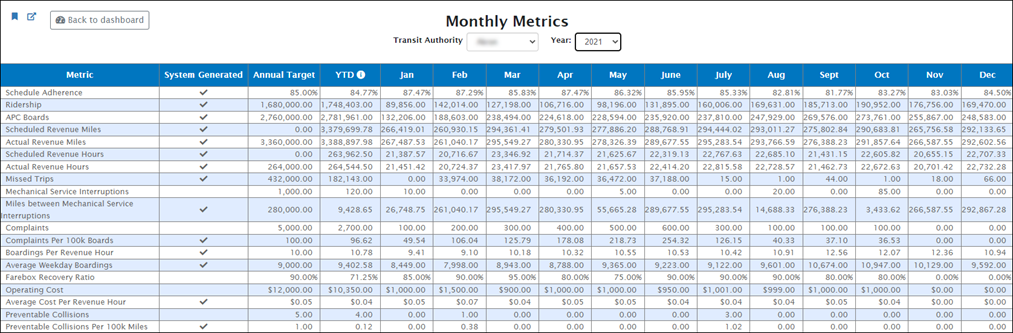
View Monthly Stats - Monthly Metrics
To view the monthly metrics, click the View Monthly Stats button below the dashboard. Use this screen to enter monthly values for user generated data and view monthly results for system generated values.
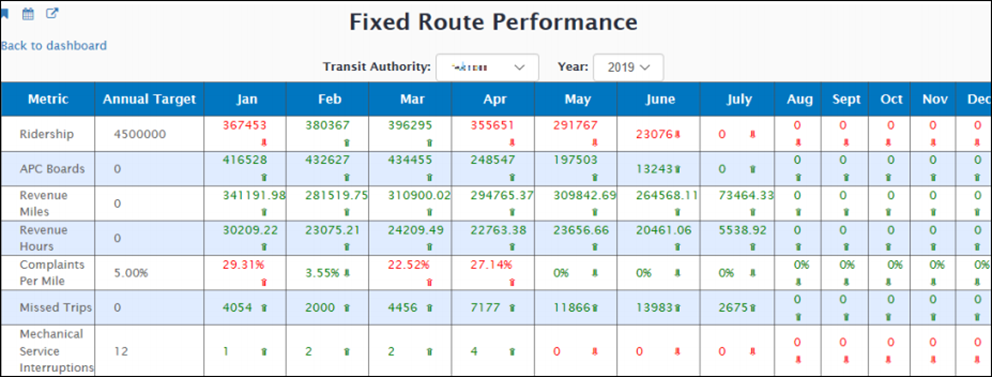
12 Month Report - Fixed Route Performance
To view the Fixed Route Performance report, click the 12 Month Report button below the dashboard. This report displays a 12-month calendar year view of statistics that users have entered and statistics that the system has calculated. Avail designed this tabular report for printing. The Target Definition page controls the metrics’ display order.
Green indicates that the value meets or exceeds the target for the metric. Red indicates that the value fails to meet the target.