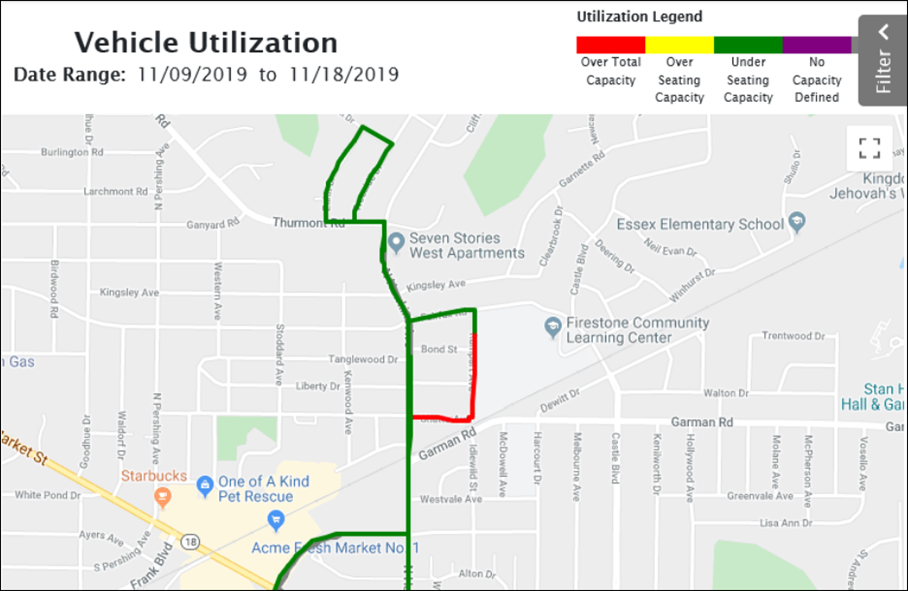
Use the Vehicle Utilization Map to display a graphical representation of the vehicle utilization statistics. Use the slider along the bottom to choose the hour of day. This control helps you identify overcapacity problems by time of day. Alternatively, click Show Data for Entire Day to display capacity for a full day.

Toggle by Hour of Day/Show Data for Entire Day.

The map above displays vehicle utilization at 12:00 noon. Vehicle utilization is color coded according to the utilization legend. The red portion of this route exceeds the total vehicle capacity at noon. Additional capacity might be required for this route at this time.
In addition to the other filters available in the vehicle utilization reports, use the following specialized filters for the Vehicle Utilization Map:
- Show/Hide Stops: Check to display stops on the route traces.
- Show/Hide segments within limits: Check to hide segments that are within acceptable utilization limits. This filter helps you focus on segments with vehicle utilization that is too high and too low.