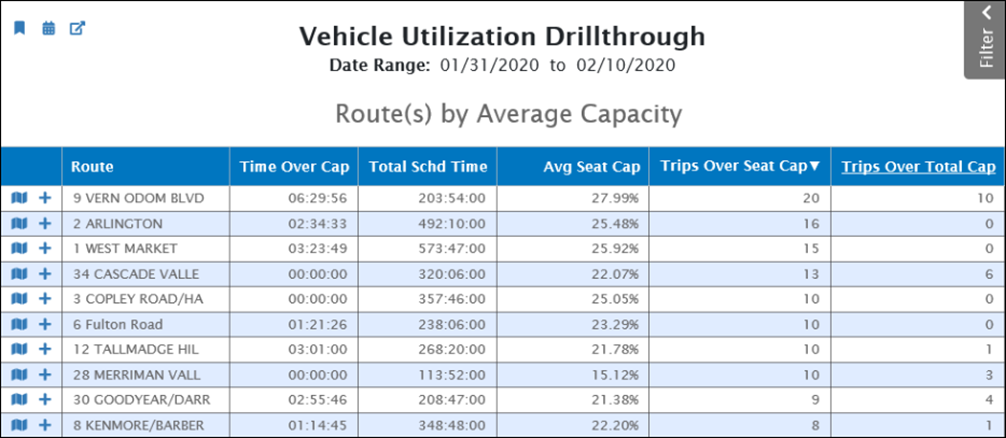
Use the Vehicle Utilization Drillthough report to drill down on route capacity problems. Initially, the table displays a list of routes over the entire date range that the filter pane specifies. Use this table to find routes that are overcapacity the most frequently using the follow three metrics:
- Running time over capacity
- Number of trips over seating capacity
- Number of trips over total capacity
Because these tables can be quite long, a good practice is to start your analysis by clicking a column heading to sort the table by that column. Multiple clicks toggle between ascending and descending sort orders. For example, click the Trips Over Seat Cap heading to display the routes with the most trips over seating capacity at the top of the table, as shown below.

In this table, click the map icon  to display the Vehicle Utilization Map for this route.
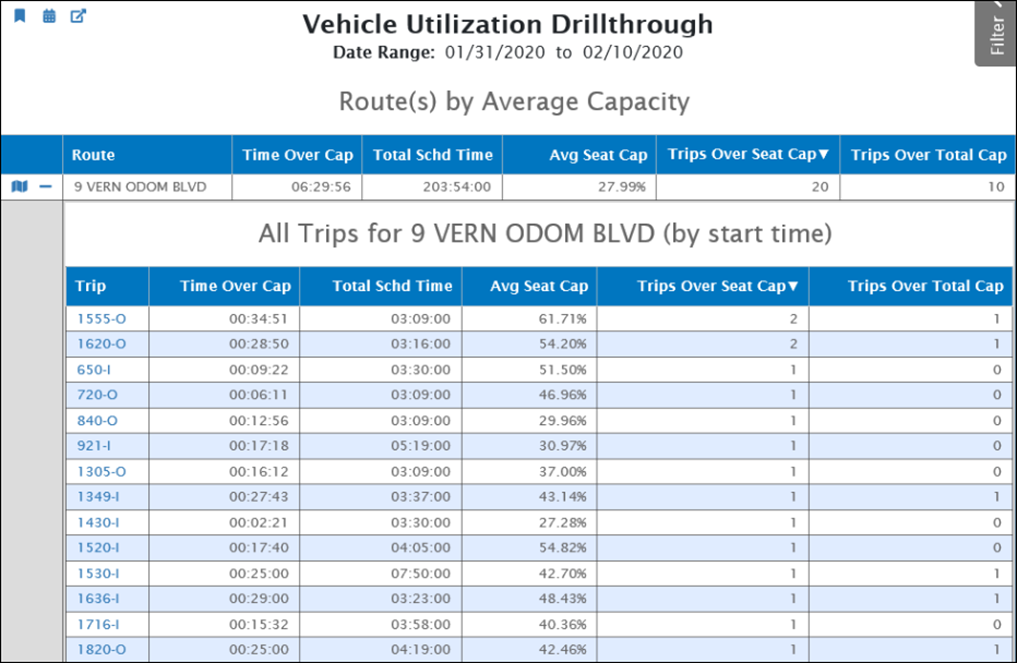
Click a + sign to display the trips for the corresponding route. The trips table is also sortable by clicking column headers. For example, the table below displays trips that exceed the seating capacity most frequency at the top.

In this table, click a specific trip to display the Farebox and APC Analysis report for that trip, which displays the boards and alights by date.