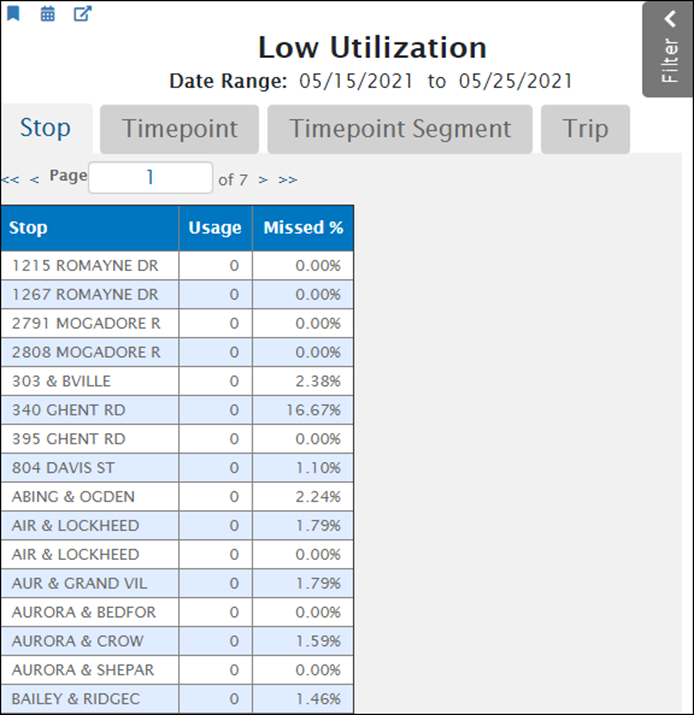
Use the low utilization report to identify stops that were missed by the vehicle and to identify if passengers are using the stops and the frequency of use. This report illustrates if stops, timepoints, timepoint segments, and trips have been missed during the date range selected in the filter pane.
- Utilization is the combination of boards and alights that represents the total activity at a stop and if the vehicle serviced the stops scheduled. The report displays utilization from lowest to highest. By default, it displays the least used stops, as shown below. Click the tabs to display utilization by other features.
- The Missed % column displays the percentage of scheduled but missed stops that weren't serviced by the vehicle. A missed stop occurs when there is a scheduled departure, but the system does not record that departure. A high percentage of missed stop reports can occur for a wide variety of reasons and affects various statistics including route utilization. After identifying routes with a high percentage of missed stops, it is critical to investigate and determine the reason why they are occurring. Below are some troubleshooting tips for next steps if the report has high values for missed and under-utilized stops.
Low Utilization Report:

Using the Report:
Click a column heading to sort the table by that column. Multiple clicks toggle between ascending and descending sort orders. For example, click the Missed% heading to sort the table by the percentage of missing stop reports.
In the filter pane, you can specify a value for Percent Returned. This filter controls the percentage of items the report displays. The default value is 10%, which causes the report to display the 10% of stops that have the lowest usage. Higher values display more items.
What are the benefits of this report?
Schedule Data Improvements
- Use this report to help determine if stops scheduled are impactful and used by passengers, and to determine the frequency of use. Are the stops under- utilized by ridership ( not used often, if at all)? This information can help you when re-defining your schedule for improvements.
- Consider pooling community interest for keeping/ removing or moving the stop on the schedule to optimize your vehicle cycles and to dedicate stop locations to more desirable areas/ points of interest.
- Did you update your schedule to account for under-utilized stops? Review your data collection over a period of time, after the schedule is live, to explore whether or not the changes support ridership needs, if trends have changed, improved, etc.
Vehicle Operator Training Needs
- Check in with your vehicle operators to inform them that they should service all stops and adhere to the schedule, to best be able to evaluate further needs.
- If stops are missed by the vehicle, it is difficult to determine passenger needs.
- Review the report again after a period of time to ensure your vehicle operators are servicing the stops and then analyze how often ridership is getting on or off the bus at that location.
Related SOP Articles: