This report displays the APC and farebox reported ridership for the date range that the filter pane specifies. Use this report to investigate the following:
- Differences between APC and Farebox ridership counts.
- Variations in ridership by time of day, time of year or service level.
- Variations in ridership by block, run, trip or stop.
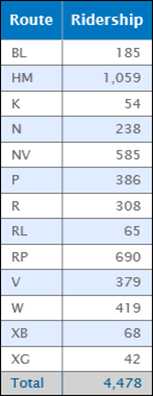
Click the Toggle Chart Data button at the top-center of the graph to switch between the graph and data table view of the data. The data table view is below:
The default chart displays ridership counts on the vertical axis for routes that display along the horizontal axis. However, you can control what both axes display.
Click on the View By drop-down to change the groupings that appear on the horizontal axis. For example, pick the Run to view ridership by Run rather than Route.
Fare Source – The system from which fare counts originate, such as Modeshift, Token Transit, Masabi, Farebox (GFI), or APC. This allows you to quickly filter and view ridership data from a specific source.
Fare Category – The category of fare used, such as Cash, Ticket, Token, Pass, or Transfer. This view helps you identify and total specific fare categories, such as transfer fares. The Fare Category can be populated and maintained by the agency in the DataPoint Setup > Fare Info.
Fare Type – The rider type associated with the fare, such as Adult, Child, Student, or Senior. This view helps you analyze total ridership by fare type, such as Senior fares. The Fare Type can be populated and maintained by the agency in the DataPoint Setup > Fare Info.
Note: Total Senior ridership is also available in the Statistics > Fixed Route Statistics report.
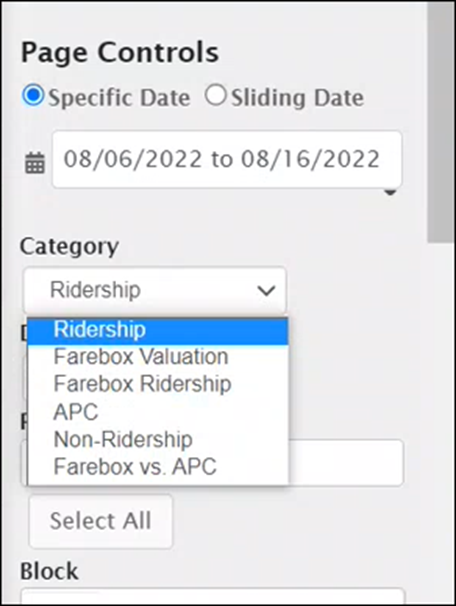
To change the outcome measure that the chart displays on the vertical axis, use the Category filter in the filter pane:
-
Category:
- Ridership: Displays data from the designated ridership source.
- Farebox Valuation: Displays ridership multiplied by the value of the fare.
- Farebox Ridership: Displays count of ridership using farebox as the source.
- APC: Displays Automatic Passenger Counts.
- Non-Ridership: Displays fare types not categorized as
- Farebox APC: Displays both farebox and APC boards.
To change how the report displays the data, use the Display By filter in the filter pane:
-
Display By:
- Chart: Display the outcome measure in a bar chart that uses the outcome measure for the vertical axis and the selected tab for the horizontal axis (Default).
- Fare Table: Display the outcome measure in a table that uses fare types for columns and the selected tab for the rows.
- Route Table: Display the outcome measure in a table that uses routes for columns and the selected tab for the rows.
Use the filter and drill-down features to customize the report for your requirements. To learn how to interact with reports, see this Business Intelligence section.
This report has been recently optimized to improve performance and decrease the running time.
In terms of navigation, users have the ability now to pick a specific report category not only when they are inside the report from the Filter Category drop-down
but also from the navigational menu:
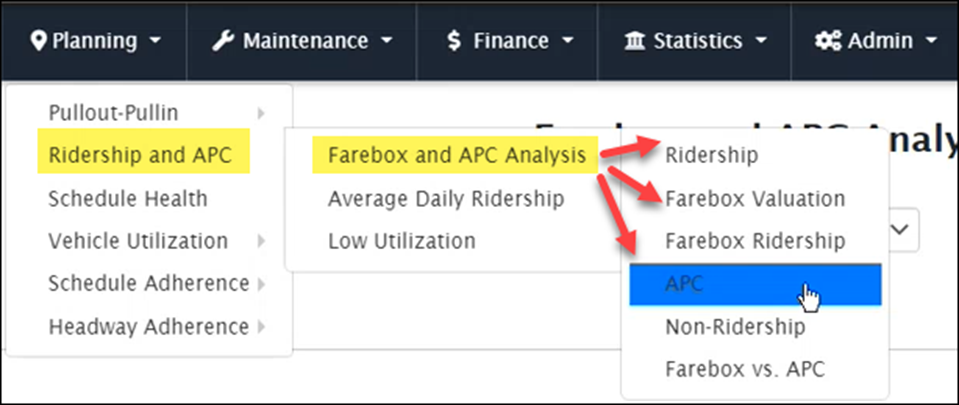
This allows for much simpler navigation and faster loading of the reports.
Video Demo
In this video, we'll show you how to access the Farebox and APC analysis report. and touch on exceptions processing and setting ridership sources.