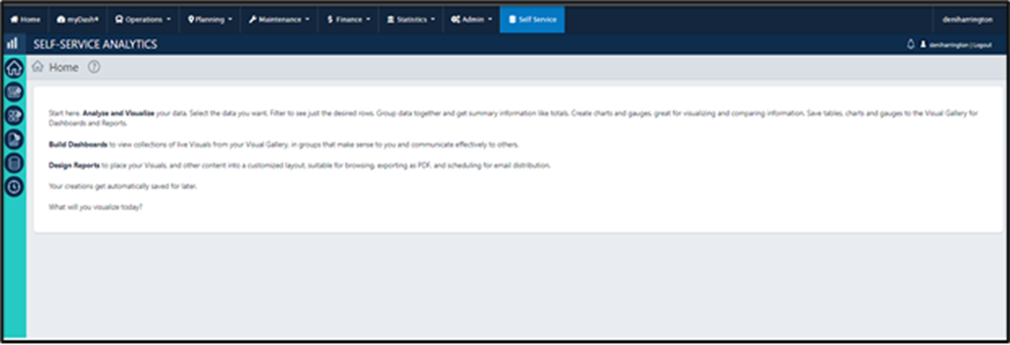
The Self-Service Analytics page presents you with a home screen with left-hand navigation to build your reports.
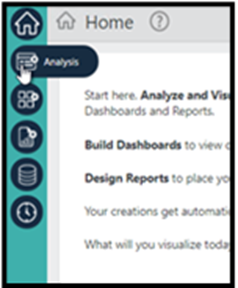
The Analysis option allows you to first select the report’s data source, followed by a data element, such as APC Data, Driver Logons, Fare Currency, Event Data, and more. You can also create custom datasets that are easily exported to an external tool like Excel.
Build visualizations with the Visual Analysis tool to add to dashboards and reports alongside your custom data tables. And you can share all work with other members of your organization.
At a high-level, Self Service Reporting capabilities include:
- Report Management interface where users manage, schedule, and share dashboards, reports, and analyses.
- Data Discovery for users to quickly visualize new insights with features like automatic data grouping, customizable in-cell graphics, and best-fit chart recommendations.
- Report Layout Editor for users to design and format print-ready reports with data visualizations.
- Query Builder for users to select the data sources they have access to, choose specific data for analysis and feed this data into the analysis grid to create visualizations.
- Metadata Builder for IT and developers to define recognizable table and column names for users to query their data.