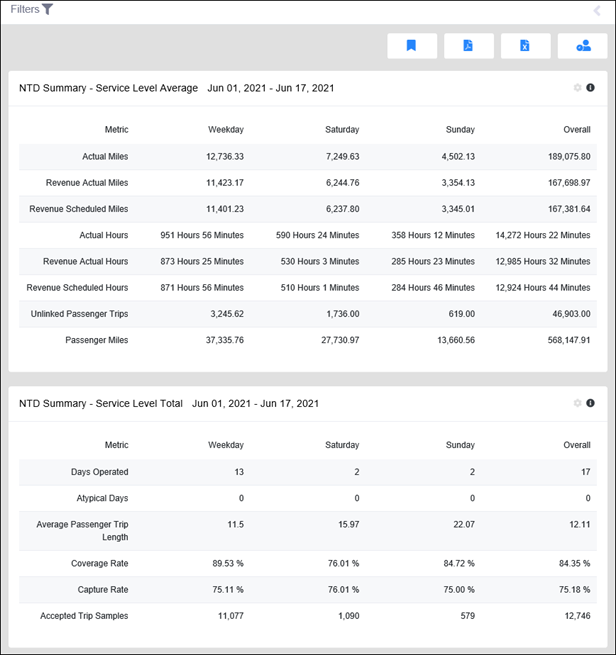
The NTD Summary report shows two sub reports: Service Level Average and Service Level Total. The Service Level Average report provides transit agencies many of the service supplied and service consumed values required by the S-10 Service Module reporting. These values include scheduled vs. actual miles and hours, unlinked passenger trips, average passenger trip length, and more.
The Service Level Total report shows the number of typical and any atypical service days that were included as well as the coverage and capture rate of the agencies’ NTD trip samples. It is very important to keep the coverage and capture rates above 50%. If your system is below 50%, you will need to perform some schedule health analysis and review vehicle APC hardware.

Filters button at the top left corner allows you to filter data to specific date range: Start and End Month, mode of service, or a route. Select a filter and click Apply.
You can export this report to either PDF or Excel by clicking on the Export as PDF button ![]() or Export as Excel button
or Export as Excel button ![]() at the top right corner. The Scheduler button
at the top right corner. The Scheduler button ![]() allows the user to schedule this report to go out in an email to, for example, a management department at any necessary frequency.
allows the user to schedule this report to go out in an email to, for example, a management department at any necessary frequency.