Navigation: ETMS > Compliance
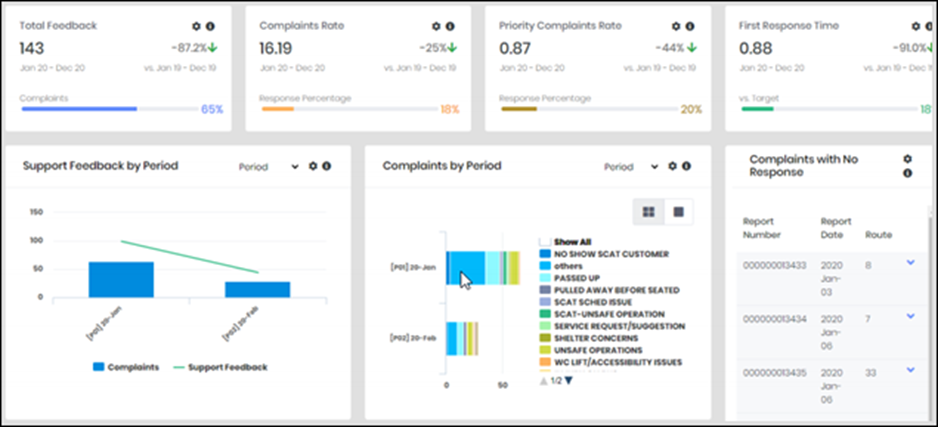
Use this dashboard to assess customer feedback and the timeliness of the customer service team’s management of these issues. Track trends by time, category, and ridership ratio to identify potential problems and target corrective measures and policy changes. Identify slow response times that might require changes to staffing and procedures.
This dashboard allows you to do the following:
- Ensure that priority complaints are not being generated faster than agency goals.
- Assess overall complaints, compare them to previous periods, and identify routes with problems.
- Track complaints over time and by category to identify emerging issues.
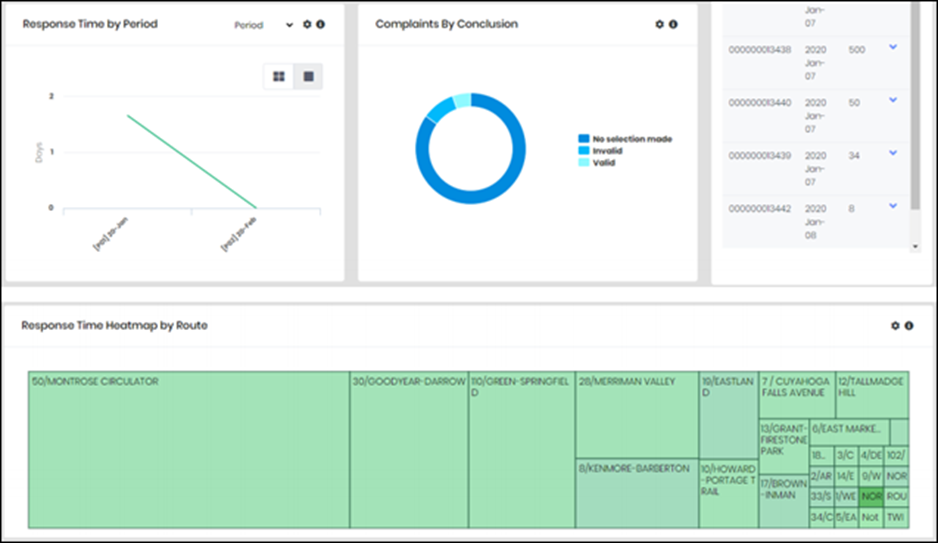
- Evaluate the first response time to assess response timeliness.
- Monitor complaints by conclusions to determine how many complaints are valid.
- View complaints with no responses to ensure that complaints are not orphaned.
The dashboard compares the metrics to target values, over time, and by various groupings, including the following:
- Routes: Displays on-time performance and productivity by routes.
- Period: Displays metrics by similar timeframes, such as day of the week, months, and fiscal years.
- Complaint Category: Types of complaints, Compliments, Service Request, Unknown.
Click the global filter icon at the top  to restrict data to specific Fiscal Years and Mode of Service for all panels in the dashboard.
Click the information icon by a panel  to learn about its metrics and how the system calculates them.