Navigation: ETMS > Finance
Executive Directors can use this dashboard to assess their agency's performance across a wide range of functions. The information allows them to intercede in problematic trends, risk items, and confidentially report on performance to stakeholders. This dashboard provides a broad spectrum of information that is available in the more specialized dashboards.
Executives can do the following:
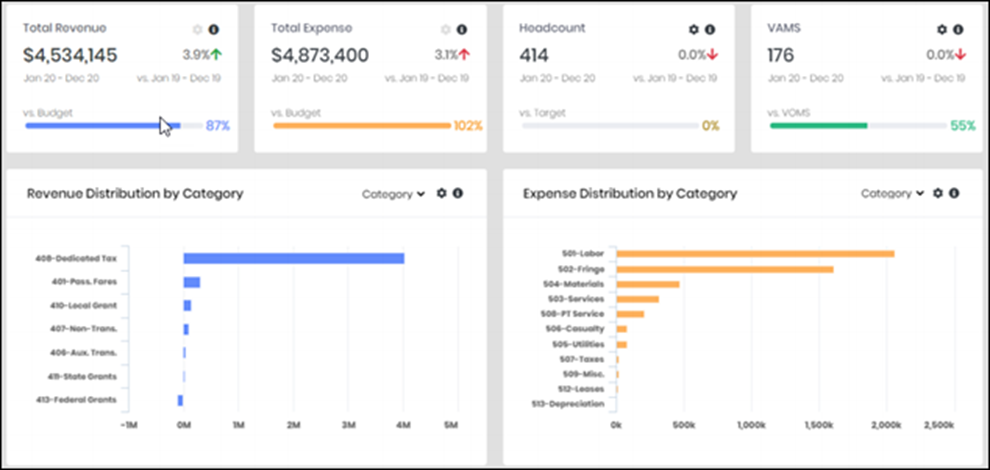
- Review trends in expenses, revenue, and track the agency’s financial position over time. The dashboard provides insight by comparing these metrics to the planned budget and against a previous time period.
- Break down revenue and expenses by Category, Division, or Period to determine where the agency’s funds are coming from and how it is spending them. When filtered by Period, the chart provides visibility into revenue and expenses by fiscal month within the selected fiscal year.
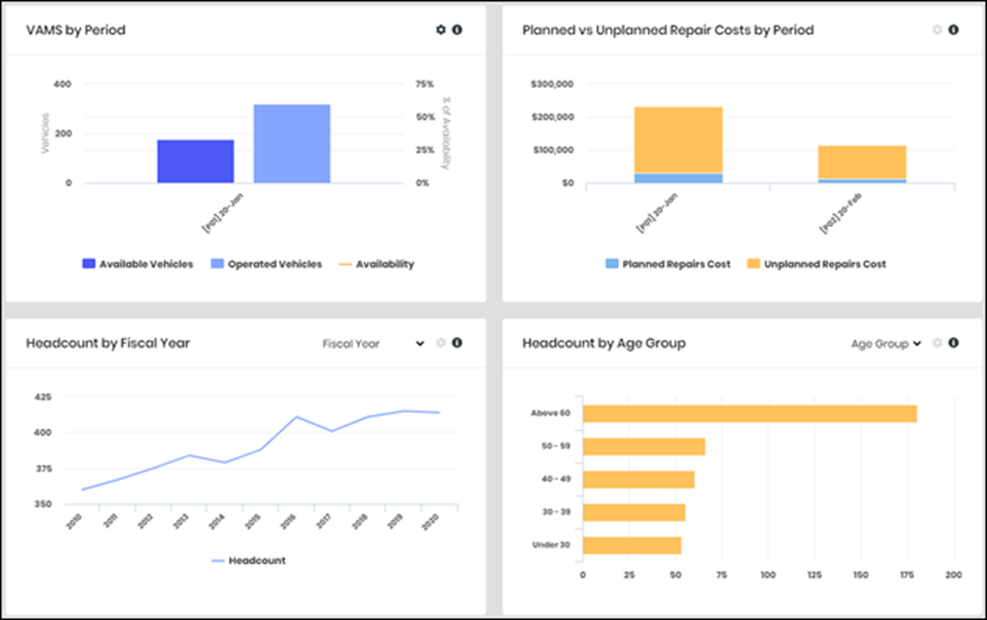
- Monitor trends in workforce headcounts, age, and turnover rates for the agency as a whole.
- Track vehicle information to determine whether the number of available vehicles is sufficient to cover maximum service (VAMS) and assess planned and unplanned repair costs by period.
Click the global filter icon at the top  to restrict data to specific Fiscal Years for all panels in the dashboard.
Click the information icon by a panel  to learn about its metrics and how the system calculates them.

