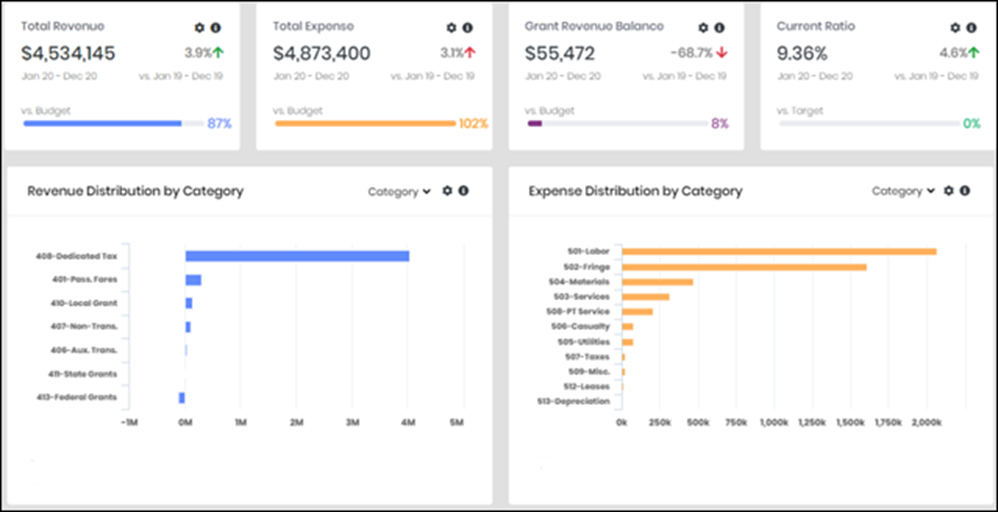
Use this dashboard to understand the overall financial health of the organization. This dashboard maps General ledger accounts to NTD Expense Objects and sources of revenue. Additionally, Avail will map accounts that your agency creates using FleetNet’s General Ledger module.
Review trends in expenses, revenue, grants, and track the agency’s financial position over time. The dashboard provides insight by comparing these metrics to the planned budget and against a previous time period.
Manage grant funding consumption by reviewing the current consumption of grant funds and comparing it to the budget and the grant consumption of the previous fiscal year for the same time. You can filter grant consumption by fiscal year, accounting periods, and grant type.
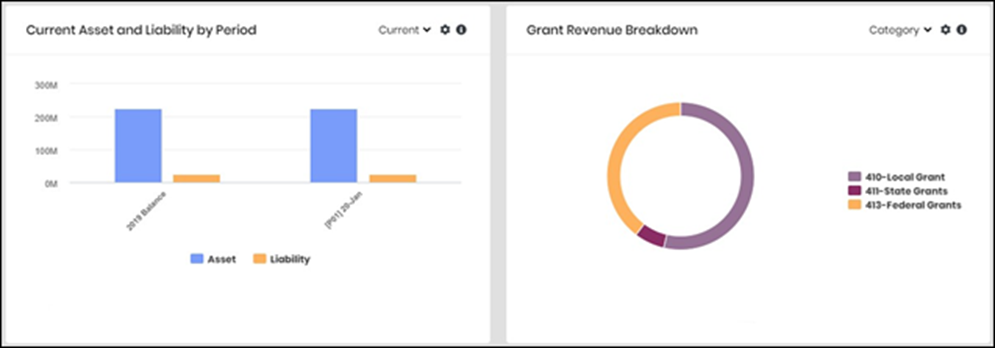
Grant Revenue Breakdown provides visibility into grant revenue distribution by Category or Period. When filtered by Category, the chart shows the proportion of revenue from local, state, and federal grants. When filtered by Period, the chart provides visibility into grant revenue by fiscal month within the selected fiscal year.
You can also evaluate items such as revenue distribution, liquidity ratio, and current liabilities and assets by period.
Drill down on these metrics in the following ways:
- Category: Displays fiscal year expense by general ledger expense category.
- Period: Displays actual expense compared to budget expense by fiscal month for the fiscal year.
- Group by Division: Displays fiscal year expenses by divisions that the agency defines.
Click the global filter icon at the top  to restrict data to specific Fiscal Years for all panels in the dashboard.
Click the information icon by a panel  to learn about its metrics and how the system calculates them.

