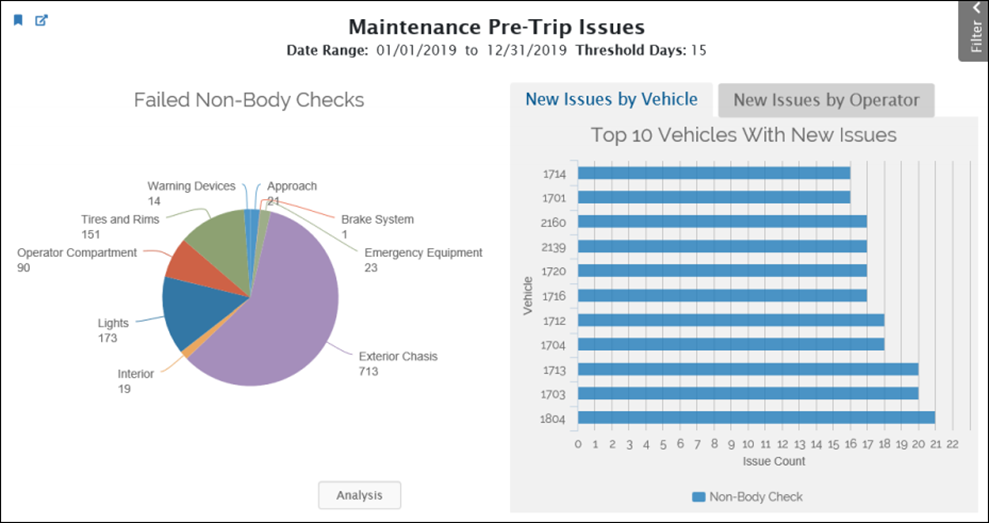
Use this report to assess the prevalence of maintenance issues detected during pre-trip inspections for the date range that the filter pane specifies. This report helps you identify the most common failures, the vehicles with the most failures, and the operators who report the most failures.
The Inspection Settings top-level tab in myAvail permits authorized personnel to configure the in-vehicle pre-trip inspection screens. This tab allows the property to specify which inspections are required, list the possible outcomes, and arrange the groupings of the checks. The in-vehicle system allows operators to save these inspection results, which populate this report.

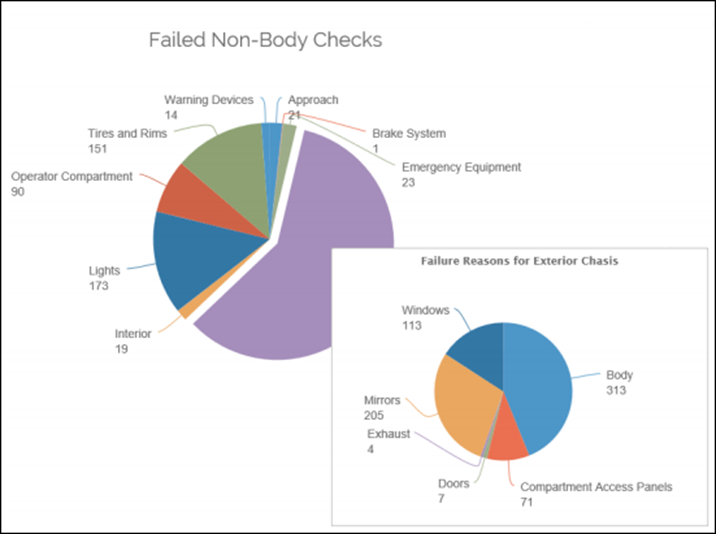
The pie chart allows you to drill down by type of failed check. Each slice represents a broad type of failure. Click a slice to drill down and identify the more detailed causes. For example, by clicking the Exterior Chassis wedge, Business Intelligence presents a pie chart that displays the failure reasons for exterior chassis. The new graph indicates that body failures are the most common type of exterior chassis failures.

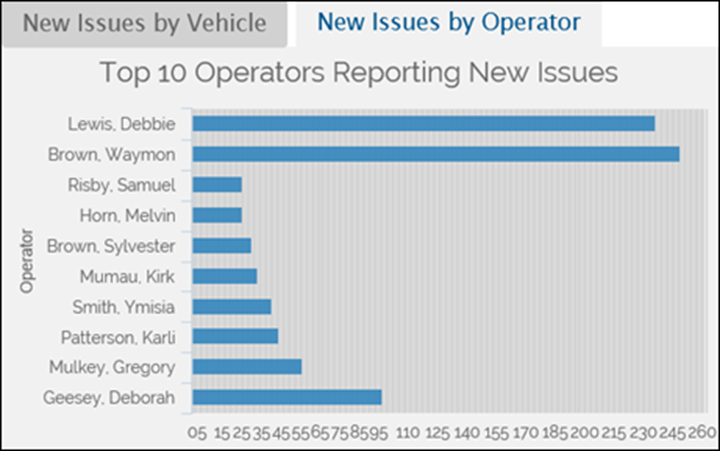
The bar chart displays the top 10 vehicles with new issues. Use this chart to identify vehicles that consistently have unusually high amounts of issues. Click the New Issues by Operator tab to display the operators that report the most issues, as shown below.

In the filter pane, you can specify a value for Threshold. This filter controls how the report counts failures for one vehicle. If a vehicle has the same failure over multiple days, the report counts it as one failure over the threshold number of days. For example, the default value is 15 days, which counts a repeated failure for one vehicle as a “new” failure only once over the past 15 days. Lower values display more new failures.
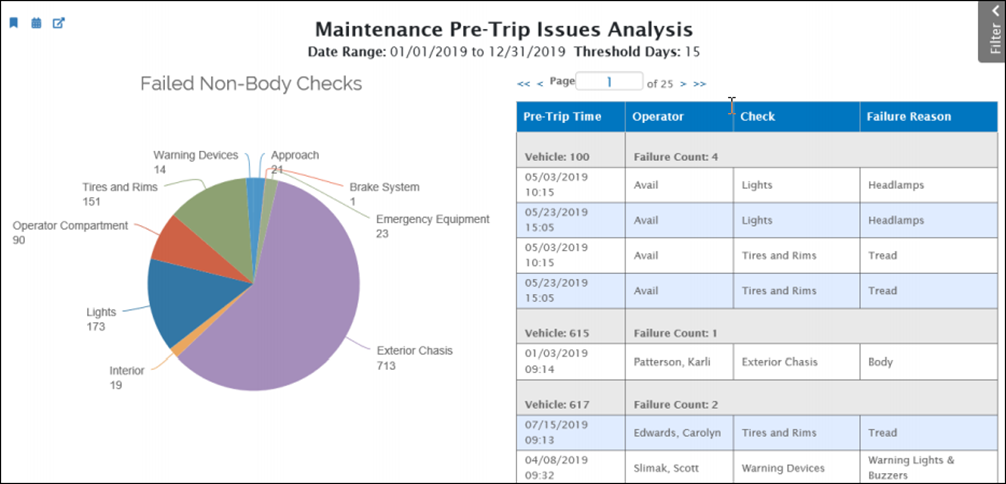
Click the Analysis button to display a table that groups the failures for each vehicle.
Maintenance Issues - Pre-Trip Issues Analysis
Use this report to identify the most common types of failures across the fleet and to group the failures for each vehicle.
The pie chart is the same as the pie chart described in the previous section.
The table lists all vehicles that have failures and provides details of those failures. This table is an easy way to group failures by vehicle. For example, the table below groups all failures for Vehicle 100 in the first section.

Click a column heading to sort the table by that column. Multiple clicks toggle between ascending and descending sort orders. For this table, the sort order applies only to the entries within each vehicle’s section. For example, if you click Failure Reason, those values are sorted within each vehicle.
If the length of the table is unwieldy, use the filter pane to reduce the data down to a specific area of focus. You can filter by operator, vehicle, check name, and failure reason.
In the filter pane, you can specify a value for Threshold. This filter controls how the report counts failures for one vehicle. If a vehicle has the same failure over multiple days, the report counts it as one failure over the threshold number of days. For example, the default value is 15 days, which counts a repeated failure for one vehicle as a “new” failure only once over the past 15 days. Lower values display more new failures.