This dashboard displays arrival performance by route. Using the information in the dashboard, you can identify routes that need performance improvements and set the priorities for these improvements. The information in this dashboard reflects the date range that the filter pane specifies.
The first bar chart displays the five worst performing routes based on their arrival statuses. The second graph displays the arrival performance for the five routes with the most riders. An impactful route might not have the worst arrival performance, but poor performance affects more riders, which might increase the priority for an impactful route.
Between these two bar charts, you can identify the worst performing routes and the routes that affect the most riders. This information can help you target remedial efforts on the routes that need it the most.

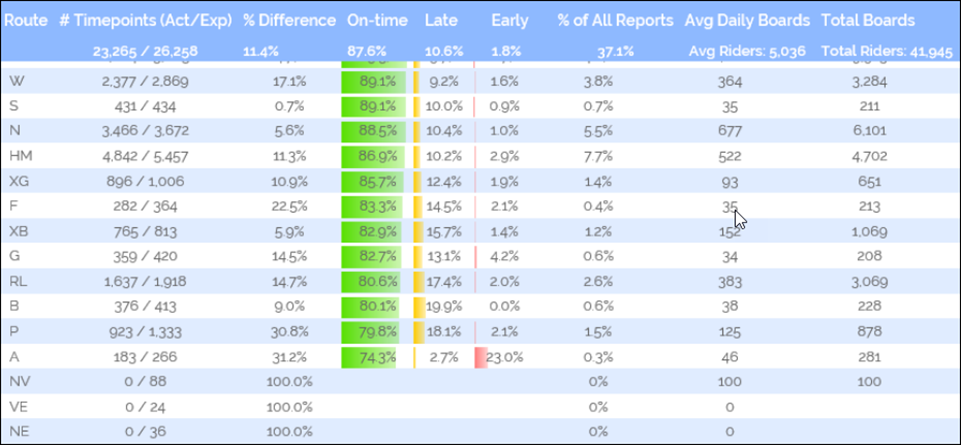
Below the bar charts, the report displays a table. This table lists the routes along with various on-time and ridership statistics. By default, this report lists the routes from the best to worst on-time performances. Click a header to sort the table by that header. Click multiple times to toggle between ascending and descending sort order.

The table includes the following information:
- Route
- #Timepoints (Act/Exp): Displays the actual and expected number of arrivals at timepoints on the route.
- %Difference: Percentage difference between actual and expected timepoint arrivals: 1- (Actual/Expected). Higher percentages represent a greater number of missed timepoints.
- On-time: Percentage of on-time arrivals for the route.
- Late: Percentage of late arrivals for the route.
- Early: Percentage of early arrivals for the route.
- % of All Reports: Percentage of reports for each route out of all reports.
- Avg Daily Boards: Average number of boards per day on the route for the date range that the filter pane specifies.
- Total Boards: Total number of boards on the route for the date range that the filter pane specifies.
For this dashboard, use the filter pane to apply filters across the entire dashboard. You can use the following specialized filters:
- Show On-time Categories: Choose the statuses that you want the chart to display: On- time, Late, and Early departures along with missed stops. By default, the dashboard displays the On-time, Late, and Early Deselect the statuses you do not want to see.
- Include Missed Stops: Check to display the proportion of missed stops. A missed stop occurs when there is a scheduled departure, but the system does not record that departure.
- Include Outliers: Check to display outliers. An outlier occurs when a value exceeds the relevant outlier threshold.
- Include Detours: Check to display data that the system records while vehicles are on a detour. These results might be atypical.
- Early Threshold (Minutes): Specify how to determine that a vehicle has arrived early. When a vehicle arrives earlier than the threshold number of minutes before the scheduled arrival time, the system counts it as an early arrival
- Late Threshold (Minutes): Specify how to determine that a vehicle has arrived late. When a vehicle arrives later than the threshold number of minutes after the scheduled arrival time, the system counts it as a late arrival.
- Early Outlier (Minutes): Specify how to determine whether a vehicle is an early outlier. When a vehicle arrives earlier than the threshold number of minutes before the scheduled arrival time, the system counts it as an early outlier. This report can track outliers separately.
- Late Outlier (Minutes): Specify how to determine whether a vehicle is a late outlier. When a vehicle arrives later than the threshold number of minutes after the scheduled arrival time, the system counts it as a late outlier. This report can track outliers separately.
- Stop Departure Threshold: Use this field to exclude stops with very low sample Enter the minimum sample size that BI will display. Smaller values will include more stops but some of those stops will have a small sample size.