Navigation: ETMS > Transit Assets
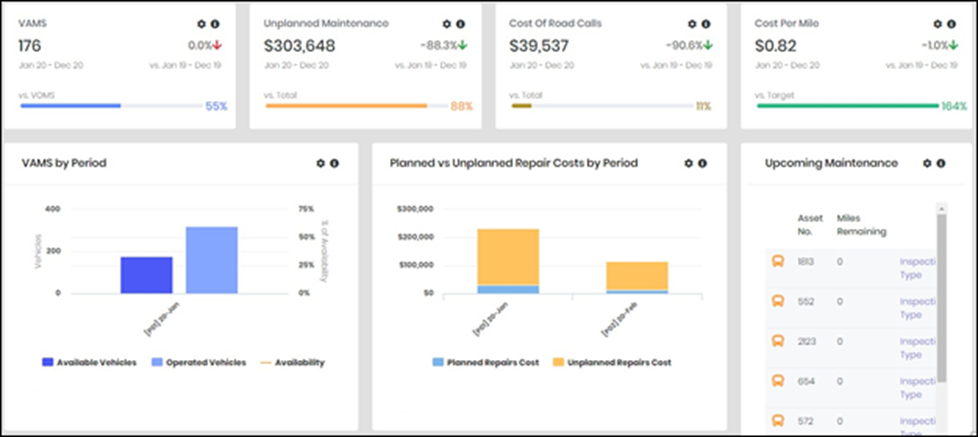
Use this dashboard to manage maintenance resources daily and to plan for the future. Gain insight into long term trends and the immediate operational needs of the maintenance department.
This dashboard allows you to do the following:
- Benchmark overall performance over time using cost per mile.
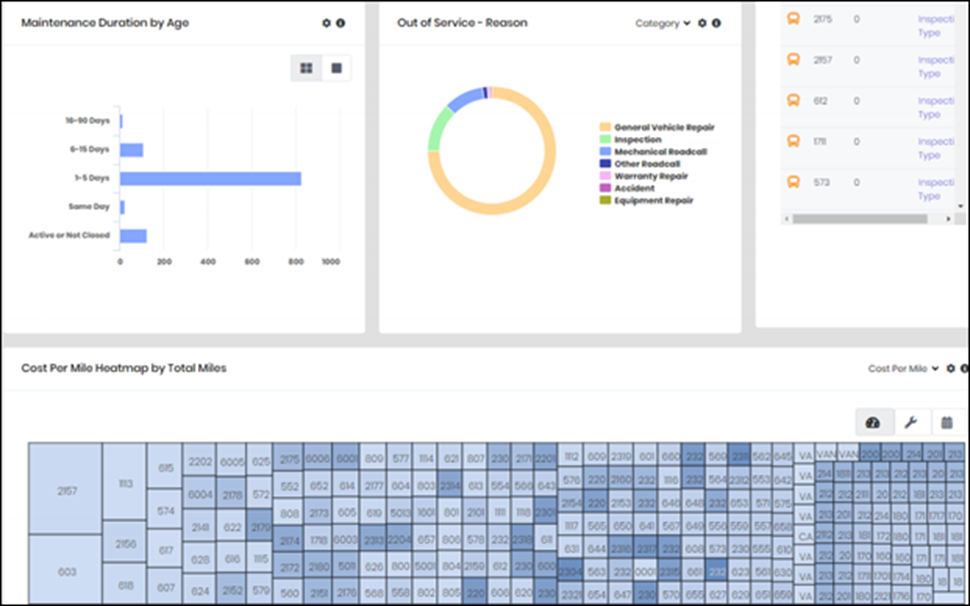
- Identify the vehicles consuming the most fuel, oil, coolant, etc.
- Identify individual vehicles with the highest cost per mile and investigate whether they require different preventative maintenance routines or replacement using the Cost Per Mile Heatmap.
- Determine whether the number of available vehicles is sufficient to cover maximum service (VAMS).
- Identify common reasons for vehicles that are out of service.
- Monitor the cost of road call maintenance items to assess the effectiveness of preventative maintenance campaigns.
- Review the performance of scheduled preventative maintenance by assessing Inspection Compliance.
- Review inventory consumption and purchasing to understand overall stocking levels.
- Review upcoming maintenance.
Click the global filter icon at the top  to restrict data to specific Fiscal Years for all panels in the dashboard.
Click the information icon by a panel  to learn about its metrics and how the system calculates them.


