Choose Schedule Health in the menu to display the Incomplete Segments by Route report. This report provides information by Agency and Route about the portion of scheduled service that is not recorded, which the report displays as a percentage of total service. Use this report to identify routes that have the most missed stops, timepoints, and trips.
This report displays three KPIs at the top for the entire property:
- Stops: Indicates the number of incomplete stop segments, total scheduled stop segments, and the percentage of missed stop segments (Incomplete/Scheduled).
- Timepoints: Indicates the number of incomplete timepoint segments, total scheduled timepoint segments, and the percentage of missed timepoint segments (Incomplete/Scheduled).
- Trips: Indicates the number of incomplete trip segments, total scheduled trip segments, and the percentage of missed trip segments (Incomplete/Scheduled).
A missed stop, timepoint, or trip segment occurs when there is scheduled service, but the system does not record that service occurring. A high percentage of missed service can occur for a wide variety of reasons and affects various statistics including route utilization. After identifying routes with high percentages of missing service, it is critical to investigate and determine the reason why they are occurring.
The graph displays the routes that have the most incomplete segments. When assessing the graph, look for groups that have unacceptable performance. Simplify this process by specifying a Sort Order in the filter pane that displays the groups by their status.
Click on the filter icon to show the filter pane. In the Sort By drop-down menu, there are six options to choose from. After you select an option, click Apply to view the filtered report. For example, if you sort by missed timepoint segments, the routes with the most missed timepoint segments (red bars) appear in descending order on the vertical axis, as shown below.

Click the bars on the graph to display the missing segments in a table. For example, when you click a green incomplete stop segment bar, the system displays the Incomplete Stop Segments report as shown below.
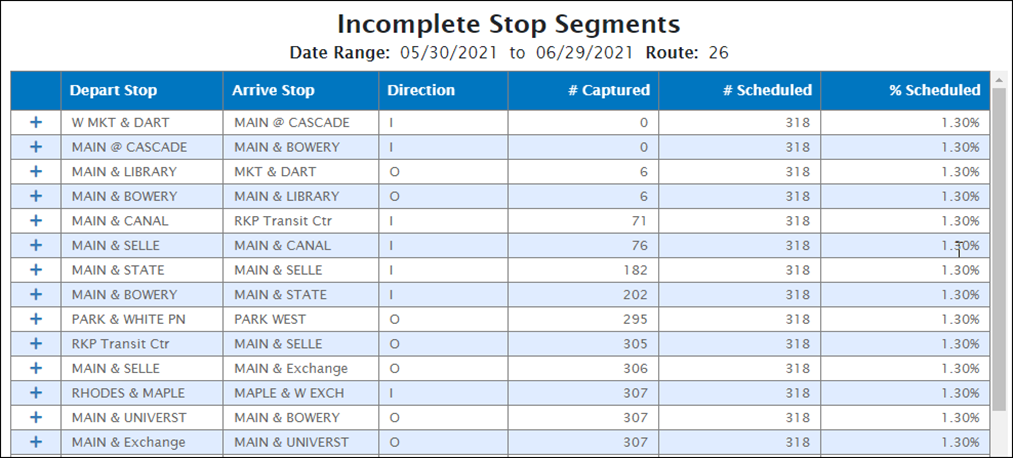
Click the plus sign for a stop segment to expand it and display incomplete segments for specific combinations of trips and patterns, as shown below.

Click the  icon to investigate an incomplete segment by replaying vehicle data in a map. This icon opens myAvail’s Geographic Tools in a new window. To load the relevant vehicle data for replay, select the Load Data button.
This icon appears only if your version of myAvail supports this feature.
A Block column has been added to the Incomplete Trip Segments, Incomplete Trip Segments by Day, Incomplete Stop Segments by Day, and Incomplete Timepoint Segments by Day reports. This column helps users more easily identify related trip details, such as the driver or adjacent trips.
Schedule Health Video Demo