
The Geographic Tools provide three related but distinct functions. These functions are the following:
-
Replay: This tool is useful for troubleshooting issues on the road ( schedule data refinements, operator training needs). Use Replay to retrace a vehicle’s movement on a map and in a data grid, like a bread crumb trail.
- How Does it Work? Replay displays data records that were automatically collected from the vehicle, based on its GPS, and compares vehicle performance/activity against the live schedule. The Replay tool is useful for troubleshooting issues on the road, such as 1) on time performance metrics 2) vehicle adherence to schedule 3) system issues
-
Trigger Boxes: These are virtual boundaries (geo fences) used to assign in- vehicle actions to occur automatically when vehicles enter or depart them at stop locations. For example, ADA announcements will play automatically. When vehicles depart trigger box locations, they automatically send an update for schedule adherence back to the dispatch office. Riders, too, can rely on seeing real time updates for stop departures in the myStop© phone app and myStop website.
- How Does it Work? Trigger boxes are 400SQ in size by default and are adjustable. They are auto-generated for all stops in the digital schedule data after the initial import completes.
- Route Traces: Use to define the visual paths between pairs of consecutive stops in the system/ defining the roads scheduled for use by vehicles in service. When routes traces are complete, they display for both dispatching monitoring tools and for public consumption ( myStop © applications.
Geographic Tools Main Page: Replay menu displayed
TIP: The functions ( functions are the menus for Replay, Trigger Boxes, Route Traces, Map Layers) that you see depend on your account permissions. For example, Customer Service Representatives and Dispatchers might be able to access Replay. On the other hand, Planners typically require access to all three functions.
The following features are common to all three major functions.
Schedule
The software defaults to display Future as best practice, however, you may use the Schedule drop-down menu to choose between the future schedule and the current schedule. A future schedule contains changes to the current schedule that myAvail will apply on a future date selected by the user. myAvail displays the Schedule drop-down menu only when you are authorized to access Trigger Boxes or Route Traces.
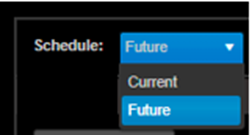
Future is the preferred as mentioned above. Making changes in the Future schedule allows the user to manage the data in an interim database, to ensure accuracy before deploying the schedule. You should not select Current because changes to the current schedule are not included when you build the new schedule using the Future schedule.
If errors are discovered in the current schedule and you cannot wait until the next schedule deployment process to correct it, you should setup a 'Correction' deployment using the Build & Deploy process.
Append and Overwrite
Each time you click Load Data, you must choose either to Append or to Overwrite the data that are currently loaded.

- Append: Retains the current data and adds the new data. Use this option when you need to extend the time frame or add additional routes to the original data.
- Overwrite: Clears the current data and starts fresh with new data. Use this option when you are investigating a series of independent issues. This is the default option.
Highlight By
Use Highlight By to determine how ETMS color codes the location indicators on the Replay map. You can choose between the following options:
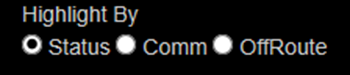
- Status: The colors of the location indicators match the operational status of the vehicle (Early, Late, On-Time, …).
- Comm: Red location indicators identify vehicles that have a Bad Communications status.
- Off Route: Red location indicators identify vehicles that are Off Route. ETMS considers a vehicle to be off route when the vehicle has deviated from the route pattern associated with the Trip ID by at least 500 feet (default).
Use the Comm and Off Route options when you are researching these types of problems specifically.
Map Layers
Use Map Layers to change what ETMS displays in the map area of the Geographic Tools tab. For example, use Map Layers to display intersecting routes or any route that you specify.
The changes apply to all three functions (Replay, Trigger Boxes, and Route Traces). The map Layers function provides three groups of controls.
Visibility
Use these toggle switches to hide or display the data that the Replay, Trigger Boxes, and Route Traces features present. Suppose a Planner selects Replay data and Trigger Boxes data for a route to diagnose a problem. The Planner can hide the Replay data without clearing it, which allows verification of a Trigger Box adjustment without reloading the replay data.
Stops
This switch toggles between showing only Time Point Stops and showing all stops for the selected routes. Use this feature to reduce screen clutter when displaying specific stop locations is not important to the task at hand.
Routes
Use to display a Route Trace that displays the trace and all stops for all patterns. If you choose a specific pattern in Trigger Boxes, ETMS displays stops for that pattern only, in addition to loading the trigger boxes in the order in which they will be serviced. Selecting the route in map layers displays all stops.
Load Data Button
Click this button to load data based on which control is open and your specifications. There is a minimum set of parameters for each function type.
Clear All Button
Click this button to clear all settings and displayed information for all functions. This button returns the entire tab (all sections) to its default state.
Geographic Tools Page Layout
The Geographic Tools page contains three regions:
- Selection Toolbar
- Map Region
- Data Grid
You can modify or hide these regions. However, their relative locations on the screen are fixed.
To change the width of the Selection Bar, position the pointer on the line between the Selection Toolbar and the Map region or Data Grid. When the pointer changes to a double-headed arrow, click and hold the left mouse button. Then, drag either right or left to change the relative widths of these areas.
To change the height of the Map Region/Data Grid, position the pointer on the line between the Map and Data Grid. When the pointer changes to a double-headed arrow, click and hold the left mouse button. Then, drag either up or down to change the relative height of these fields.
To hide the Selection Toolbar, click the small white arrow in the center of the line dividing the Map Region and the Data Grid. Click the same spot again to restore the Selection Toolbar.
How to Change Visible Data Grid
The Map Region displays the data from all three functional areas unless you alter it by using the Map Layers function. The Data Grid displays only one set of data at a time. Click the tabs on the Data Grid to change the data that myAvail displays in the grid.
What Replay Information is Available
You can display the following columns in the replay data grid.
If there is a blue save icon in the upper right corner of the table grid, you have permission to change the columns displayed and to alter the layout.
If there is a yellow/gold save icon above and on the right of the table grid, you have permission to change the default columns displayed, and the ability to alter the overall layout for all users. The yellow icon is typically assigned to managerial, supervisory staff.
Below is a table that displays each column available in Geo Tools, and whether or not it is readily visible.
| ETMS Column Name | Definition |
Default - Visible (V) Not Visible (NV) |
| Label | Number represents data record retrieval sequence. #1 is first data record based on timestamp, #2 is second data record based on timestamp, #3 is third, based on time, etc. |
V |
| Time | Actual time vehicle reported data |
V |
| Server Time | Server time is based on when the record was recorded in the database |
NV |
| Longitude | Longitude is the east/ west positioning of the vehicle on Earth |
NV |
| Latitude | Latitude is the north/ south positioning of the vehicle on Earth |
NV |
| Vehicle ID | All vehicles are assigned a unique Id on the Vehicle Card. This id is use throughout the system to identify its unique components/ attributes |
NV |
| Vehicle | All vehicles are assigned a unique Id on the Vehicle Card. This id is use throughout the system to identify its unique components/ attributes |
V |
| Operator ID | The vehicle operator who logged in via the MDT displays their unique employee Id |
V |
| Operator | The vehicle operator name logged in at the time of data capture |
V |
| Block | All vehicles are assigned a block. This is inclusive of the digital schedule data |
V |
| Run ID | Each service piece is assigned a Run Id |
NV |
| Run | A run is a set of consecutive trips to be performed in sequence by a vehicle. Each service day includes two runs. |
V |
| Route ID | A route is assigned a unique Id to help delineate and distinguish between service offerings for each service level and service day. |
NV |
| Route | Each route is scheduled to run for a service day and includes two runs. Each run is comprised of a set of trips. |
V |
| Trip | A trip is a collection of scheduled stops, and depart times, for a route's specific direction. |
V |
| Trip Direction | A set of scheduled stops, for a specific pattern. examples- north, west, east, south, inbound, outbound. loop. etc. |
V |
| Stop | A specific location on Earth, based on latitude and longitude. A schedule area where passengers may be picked up/ dropped off |
V |
| Stop Name | All service stops include a unique name (and numeric Id) to assist ridership with trip planning needs |
V |
| Previous Stop | A scheduled stop that proceeded the next to service |
NV |
| Departure Time | The actual time a vehicle left the current stop location |
NV |
| Distance | Value displays length of time a vehicle is off route? |
NV |
| MSG Types |
Avl report MSG- automatic vehicle location (GPS). Arrival Stop report- within the scheduled trigger box. Stop report- vehicle has entered the scheduled trigger box. Door is open for boarding/ alighting passengers. Route Trip Change report- vehicle is in trigger box and has completed the last trip for the route and is scheduled for another route and trip from this location. Bad Comms- vehicle has lost communications to the backend software |
NV |
| Stop Report | Data retrieved at a specific scheduled stop. The vehicle is within the trigger box. Vehicle door has been opened. |
V |
| Status | Status refers to vehicle performance against the digital schedule. OTP- on-time, late, early, off route, logged in, headway bunched, headway gapped, etc. |
V |
| Deviation | This is a set of minutes that identifies the time attributed to a vehicle's status: on time, late, off route, etc. |
V |
| Speed | Speed is calculated against 2 things: Vehicle GPS and road information. Example: Main Street- speed is 25 MPH, Grant Highway speed is 55 MPH and alert threshold settings established during project implementation |
V |
| Direction | Indicates if the vehicle is traveling west, east, south, north, or off route |
V |
| Onboard | This represents the number of passengers on the vehicle completing trips |
V |
| Boards | This represents each passenger that boards the vehicle at a scheduled stop |
V |
| Alights | This represents each passenger that gets off the vehicle at a scheduled stop |
V |
| Dwell Time | This is the time attributed to a vehicle within a trigger box. Example: Vehicle enters stop at 10:05 and departs the stop, or trigger box, at 10:07. Dwell time is 2 minutes. |
V |
| Alarm State | This column displays if an EA was sent in to Operations/ dispatch from the vehicle. EA- emergency alarm |
V - shows false as blank |
| Stationary Status | Column indicates if, the vehicle is not moving. |
V - Displays Non-Stationary as blank |
| Stationary Duration | Column indicates the length of time a vehicle is not moving/ engine idling. Some states regulate stationary status for emissions control. |
V |
| Off Route | The vehicle has deviated from it's scheduled route trace/ road. Off route vehicles do not display for ridership use on myStop tools and don't collect revenue data against the digital schedule. Data is captured as 'undefined'. |
V - Displays On Route as a blank |
| Operational Status | Refers to vehicle performance against the digital schedule. OTP- on-time, late, early, out of service (OOO) |
V |
| Comms Status | Indicates if communications to the vehicle are established, have failed, and displays messages sent/ received |
V |
| GPS Status | Indicates if the GPS connection is established |
V - Displays GOOD GPS as a blank |
| Vehicle Health | Vehicle health alerts automatically generated by the J1939 sensor: displays SPN, FMI codes and populates in BI maintenance reports |
NV - When made visible displays -1 as a blank |
| Odometer | Indicates vehicle miles/ hours traveled in _______? |
NV |
| MDT Flags |
|
NV |
| Headway Status | Indicates if vehicles on a headway route are bunched or gapped. This information helps ensure vehicles are well- spaced to distribute ridership. |
NV |
| Scheduled Headway | Optimal conditions- meaning all vehicles servicing the route are equally spaced |
NV |
| Actual Headway | Real time calculations based on actual vehicle positions on the route |
NV |
If you want to adjust the columns that display, press the three dots on any column header, then select 'columns', to access the menu for column arrangement- NV-not visible or V- visible. Check the box in the menu to hide or show columns:. Those with a blue check are visible: